
Last quarter, our production team faced a 12% spike in titanium alloy costs 1. Within weeks, buyers started asking tough questions about price increases. This scenario plays out constantly in the medical device industry 2. You need leverage, and raw material data gives you exactly that.
To negotiate shockwave therapy machine prices using raw material fluctuations, monitor commodity indices like LME metals and semiconductor reports, request detailed cost breakdowns from suppliers, time purchases during market dips, and propose price-adjustment clauses tied to verified material indices in your OEM contracts.
Understanding how raw materials impact machine pricing transforms you from a passive buyer into a strategic negotiator LME metals 3. This guide breaks down exactly how to use market data, evidence demands, and contract clauses to protect your margins.
How do fluctuations in metal and electronic component costs impact my shockwave therapy machine's unit price?
When we source titanium for our applicator heads 4, even a 5% price swing changes our entire cost structure semiconductor reports 5. You feel this impact directly in your invoice. The connection between commodity markets and your final price is more direct than most buyers realize Most Favored Nation provisions 6.
Metal and electronic component costs account for 40-60% of shockwave therapy machine manufacturing costs. Titanium alloy fluctuations affect applicator and handpiece pricing, while semiconductor volatility impacts control boards. A 10-15% rise in metals can increase machine prices by 5-8%, depending on manufacturer hedging strategies.
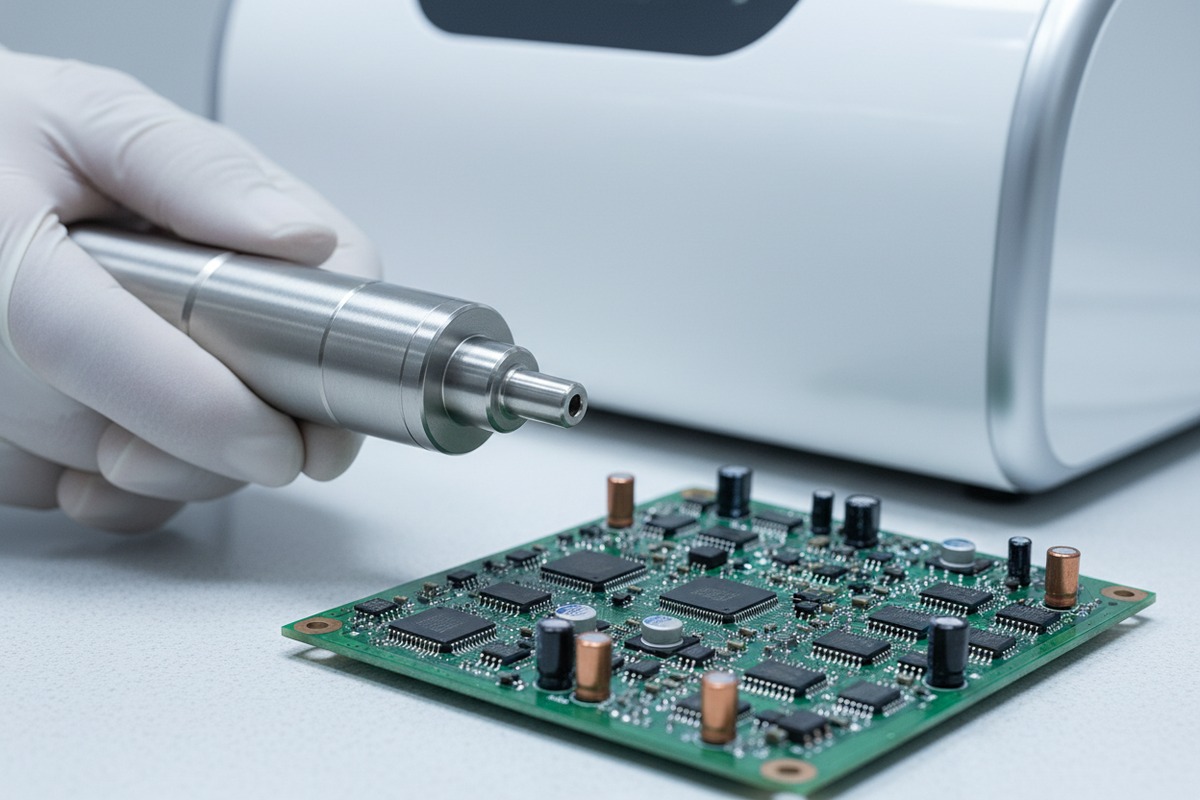
Breaking Down the Cost Structure
Our engineering team tracks every material input. Here is how the costs typically distribute across a mid-range shockwave therapy machine:
| Component | Primary Materials | Cost Share | Volatility Level |
|---|---|---|---|
| Applicator/Handpiece | Titanium alloy, aluminum | 25-30% | High |
| Transducer Assembly | Piezoelectric ceramics 7, copper | 15-20% | Medium |
| Control Unit | Semiconductors, PCBs | 20-25% | High |
| Housing/Chassis | ABS plastic, polycarbonate | 10-15% | Medium |
| Power Supply | Copper, transformers | 8-12% | Medium |
| Cables/Connectors | Copper, polymers | 5-8% | Low |
Why Metals Matter Most
Titanium and aluminum alloys dominate applicator construction. These materials must withstand millions of shockwave pulses without degrading. Aerospace industry demand directly competes with medical device needs. When Boeing ramps up production, your shockwave machine costs rise too.
In 2024-2025, titanium prices increased 10-15% due to supply chain constraints. Our factory absorbed some of this through forward contracts. But smaller manufacturers pass these costs directly to buyers.
The Semiconductor Factor
Control boards use specialized chips for pulse timing and energy delivery. The post-2020 chip shortage 8 never fully resolved. Lead times for medical-grade semiconductors remain 20-30 weeks. When demand spikes, prices follow.
Focused shockwave machines suffer more from chip volatility. Their precise energy delivery requires more sophisticated electronics than radial units. This explains part of the $13,000-$39,000 price range for high-end focused systems versus $3,000-$5,000 for basic radial units.
How Manufacturers Respond
Smart manufacturers hedge against volatility. We maintain 6-month material reserves for critical components. We also negotiate annual supply contracts with metal suppliers. These strategies stabilize our pricing.
Ask your supplier directly: "How do you hedge against raw material volatility?" Their answer reveals their pricing stability. Manufacturers without hedging strategies pass every market fluctuation to you.
How can I monitor raw material market trends to time my bulk inventory purchases more effectively?
Our procurement team checks commodity indices every Monday morning. This habit saved one of our European partners €15,000 on a 20-unit order last year. Timing purchases with market dips requires consistent monitoring and quick decision-making.
Monitor raw material trends through London Metal Exchange (LME) for titanium and aluminum, semiconductor industry reports from IC Insights or Gartner, and oil price indices for polymer costs. Set price alerts at 5% below current levels, track 90-day moving averages, and maintain relationships with suppliers who share market intelligence.

Key Indices to Track
Different materials require different data sources. Here is your monitoring checklist:
| Material Type | Primary Index/Source | Update Frequency | Alert Threshold |
|---|---|---|---|
| Titanium | LME, USGS Reports | Weekly | ±5% change |
| Aluminum | LME Aluminum Spot | Daily | ±3% change |
| Copper | COMEX Copper | Daily | ±4% change |
| Semiconductors | IC Insights, Gartner | Monthly | Lead time changes |
| Plastics/Polymers | Oil futures (WTI/Brent) | Daily | ±5% change |
Building Your Intelligence Network
Raw data only helps if you interpret it correctly. We recommend three intelligence layers:
First, subscribe to industry newsletters. Medical device manufacturing associations publish monthly material cost updates. These reports connect raw commodity data to actual device pricing impacts.
Second, build relationships with multiple suppliers. When we quote projects, we share general market observations with trusted partners. Ask your current supplier: "Where do you see titanium prices heading in Q3?" Genuine partnerships include information sharing.
Third, track your own purchase history. Create a simple spreadsheet linking your order dates to material index levels. After 12 months, patterns emerge. You will see which months typically offer better pricing.
Optimal Purchase Timing
Historical data shows predictable patterns. January and February often bring higher prices as manufacturers restock after year-end inventory depletion. Summer months sometimes offer dips as demand slows.
However, do not wait for perfect timing. A 10% savings opportunity today beats a theoretical 15% savings that never materializes. Set your target discount, and pull the trigger when markets reach that level.
Working with Currency Fluctuations
For US and European buyers sourcing from China, exchange rates compound material volatility. A 10-20% forex swing can erase material savings entirely.
Request quotes in your local currency when possible. If that fails, use forward contracts through your bank. Lock in exchange rates when favorable, regardless of immediate purchasing plans.
Our finance team recommends watching both material indices and USD/EUR rates simultaneously. The optimal purchase window opens when both factors align favorably.
What evidence should I demand from my manufacturer to justify a price increase based on raw material costs?
When a supplier emailed us requesting a 12% price increase citing "material costs," our partner in Texas asked the right question: "Show me the data." That single request reduced the proposed increase to 6%. Evidence demands separate legitimate adjustments from opportunistic margin grabs.
Demand itemized cost breakdowns showing material percentages, third-party commodity index data covering the relevant period, purchase invoices from their material suppliers, and historical pricing comparison charts. Legitimate manufacturers document material cost impacts transparently and welcome verification requests.

The Documentation Checklist
Before accepting any price increase, request these specific documents:
Itemized Bill of Materials
Ask for a component-by-component breakdown showing material types and weights. This document reveals which materials actually drive costs. If titanium represents only 8% of their costs, a 15% titanium price increase cannot justify a 10% machine price increase.
Our sales team provides this breakdown willingly. We understand that trust requires transparency. Suppliers who refuse itemized breakdowns may be hiding inflated margins.
Third-Party Index Verification
Require references to specific commodity indices matching the increase period. If your supplier claims copper costs rose 20% in Q1, LME copper data should confirm this. Discrepancies indicate either dishonesty or poor procurement practices.
Supplier Purchase Documentation
Request redacted invoices showing their actual material purchases. Dates should precede the price increase request. Quantities should align with your order volumes. Sophisticated buyers verify the entire chain.
Historical Comparison Analysis
Ask for a chart showing material costs versus machine prices over 24 months. This context reveals whether the current increase follows established patterns or represents an outlier.
| Evidence Type | What It Shows | Red Flags |
|---|---|---|
| Bill of Materials | Component cost percentages | Missing items, vague categories |
| Index Data | Market price movements | Wrong time periods, wrong materials |
| Purchase Invoices | Actual costs paid | Missing dates, inconsistent quantities |
| Historical Chart | Price trend patterns | Sudden jumps without market correlation |
Negotiating After Evidence Review
Once you have documentation, calculate whether the proposed increase is proportional. Use this formula:
Justified increase = (Material cost share) × (Actual index increase)
If materials represent 50% of costs and indices rose 10%, a 5% price increase is proportional. Anything beyond this requires additional justification.
Our procurement partners who follow this process typically negotiate price increases down by 30-50% from initial requests. Evidence transforms adversarial negotiations into collaborative problem-solving.
Can I negotiate a price-adjustment clause in my OEM contract to protect my margins from future market volatility?
Our legal team drafted our first price-adjustment clause in 2019. Since then, we have refined it through dozens of OEM partnerships. Yes, these clauses work. Both parties benefit from predictable, fair adjustments rather than adversarial renegotiations.
Price-adjustment clauses tied to verified commodity indices protect both buyers and suppliers from market volatility. Structure clauses with specific index references, threshold triggers (typically ±5-10%), adjustment caps (usually 10-15% annually), and review periods. Include Most Favored Nation provisions to ensure competitive pricing.
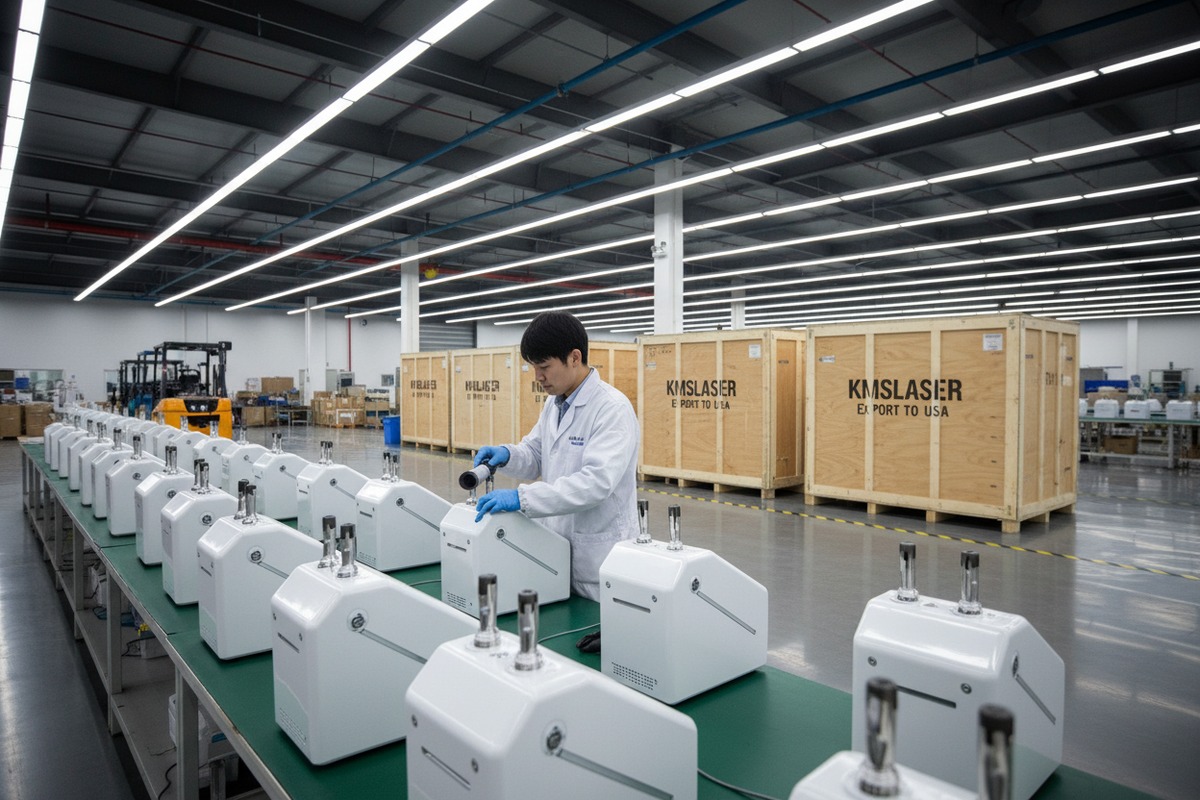
Essential Clause Elements
Effective price-adjustment clauses include five core components:
Index Reference
Specify exactly which indices trigger adjustments. Use recognized benchmarks like LME for metals or published semiconductor price reports. Vague references create disputes.
Example language: "Adjustments shall reference the London Metal Exchange aluminum spot price, averaged over the preceding 90-day period."
Threshold Triggers
Small fluctuations should not trigger constant adjustments. Set thresholds that filter market noise while capturing significant movements.
| Threshold Level | Best For | Risk Level |
|---|---|---|
| ±3% | High-volume, low-margin contracts | High administrative burden |
| ±5% | Standard OEM agreements | Balanced approach |
| ±10% | Long-term partnerships | May miss moderate swings |
Adjustment Caps
Protect against catastrophic increases by capping annual adjustments. Suppliers accept this because it also limits their downside exposure during market crashes.
Standard caps range from 10-15% annually. Our contracts typically use 12% caps with quarterly review options for extreme circumstances.
Review Periods
Define when parties can invoke adjustments. Quarterly reviews suit volatile markets. Semi-annual reviews work for stable relationships. Avoid monthly reviews—administrative burden exceeds benefits.
Most Favored Nation (MFN) Provisions
MFN clauses ensure you receive the best pricing offered to comparable customers. If your supplier drops prices for a competitor, you automatically qualify.
Suppliers sometimes resist MFN clauses. They argue market changes justify different pricing tiers. Negotiate a middle ground: MFN applies to customers with similar volumes and terms.
Sample Clause Framework
Our standard OEM agreements include this structure:
"Price adjustments for titanium-dependent components shall occur semi-annually when LME titanium spot prices, averaged over the preceding 180 days, differ by more than 5% from the baseline established at contract signing. Adjustments shall not exceed 12% annually in either direction. Both parties commit to Most Favored Nation pricing for agreements of comparable scope."
This framework protects your margins while maintaining supplier viability. Neither party wins from pushing partners into unprofitability.
Supplier Resistance Strategies
Some suppliers reject fluctuation clauses entirely. They prefer fixed pricing or progressive minimum purchase quotas. When facing resistance:
First, demonstrate mutual benefit. Clauses protect suppliers during price drops too. They avoid embarrassing price increase requests during good market conditions.
Second, offer volume commitments in exchange. Suppliers accept more contract complexity when paired with guaranteed orders. Year 1 minimums of 10 units with 15-20% annual growth provide revenue certainty.
Third, propose pilot periods. A 12-month trial with simplified terms builds trust for more comprehensive future agreements.
Conclusion
Raw material fluctuations create both risk and opportunity for shockwave therapy machine buyers. Monitor commodity indices, demand evidence for price increases, and negotiate protective contract clauses. These strategies transform market volatility from a threat into leverage for better deals.
Footnotes
1. Provides historical and current producer price index data for titanium alloy mill shapes. ↩︎
2. Offers facts and an overview of the medical technology industry in the U.S. ↩︎
3. Official website for the London Metal Exchange, a global reference for base metals trading. ↩︎
4. Details the use of titanium in medical technology, including implants and surgical devices. ↩︎
5. Provides an authoritative global outlook and analysis of the semiconductor industry. ↩︎
6. Provides a legal definition and explanation of Most Favored Nation clauses in contract law. ↩︎
7. Replaced with the relevant section on piezoelectric ceramics within the main Wikipedia article on Piezoelectricity, an authoritative source. ↩︎
8. Details the causes, impacts, and timeline of the global semiconductor chip shortage. ↩︎

 English
  Español de México
  Deutsch
  Français
  العربية
  Русский